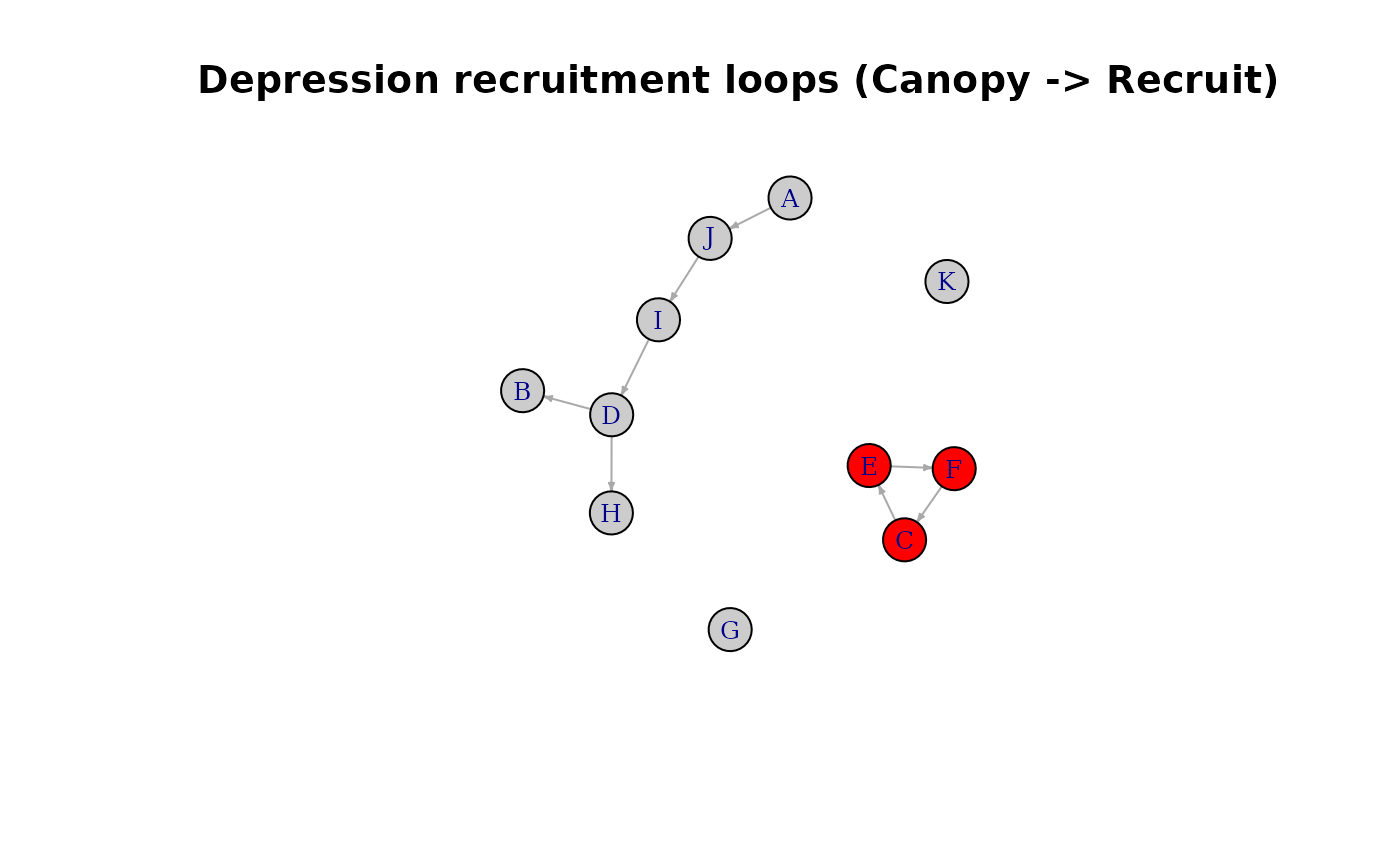
Allow the visualization of intransitivity loops of recruitment depression
Source:R/visu_topol_depre.R
visu_topol_depre.RdThis function allows the visualization of intransitivity loops of recruitment depression differentiated from the rest of nodes (in grey). Nodes in different SCC are identified by different colors, and the rest of nodes, not belonging to any SCC are presented in grey The direction of the arrows indicate the depressing effect of the canopy species (origin of the arrow) on the recruitment of the recruit species (head of the arrow). It may be frequent that in recruitment enhancement (i.e. facilitation) or depression (i.e.competition) networks, there is not any SCC as they tend to have smaller dimensions that general recruitment networks.
Usage
visu_topol_depre(
  int_data,
  cover_data,
  layout_fun = igraph::layout_with_fr,
  vertex_size = 20,
  edge_arrow_size = 0.4
)
Arguments
- int_data
data frame containing interaction data.
- cover_data
data frame with the abundance of each canopy species in each plot.
- layout_fun
type of igraph layout (see
igraph::layout_())- vertex_size
numeric
- edge_arrow_size
numeric