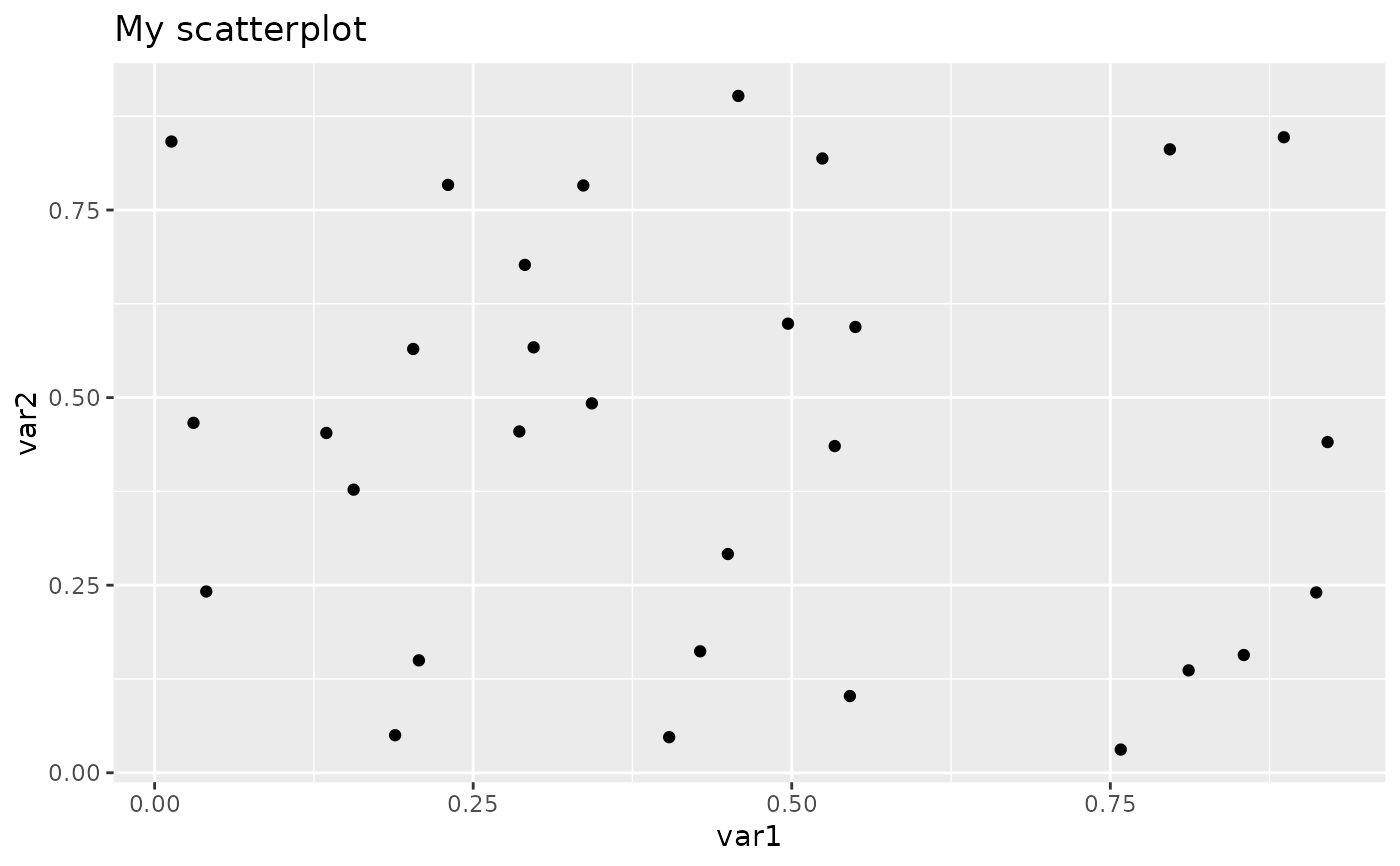
Make a scatterplot of two numeric variables using ggplot2::ggplot().
Arguments
- var1
Numeric vector
- var2
Numeric vector
- ...
Optional arguments to be passed to
ggplot2::labs()such astitle,xoryto define plot title, horizontal axis or vertical axis names, respectively
Examples
data("exampledata")
make_scatterplot(exampledata$x, exampledata$y, title = "My scatterplot")